How big is the carbon removal market today?
Building a dashboard to measure our progress to remove 10Gt of CO2 by 2050
Note: We’ve launched a live version of the CDR dashboard! Check it out at cdr.fyi
Speed, Scale & Climate OKRs
I’ve been making my way through John Doerr’s Speed & Scale, which examines the climate crisis and proposes a set of OKRs to help guide us to net zero by 2050.
There’s a lot to love about this book. John provides one of the simplest (and familiar, for those who have used OKRs) frameworks I’ve come across for thinking about how different climate solutions fit together to avoid climate catastrophe. He also frames potential solutions as measurable goals, which gives us a way to track our progress toward solving the climate crisis.
At Segment we organized our annual & quarterly plans around OKRs, and there was one major indicator of whether an OKR would be achieved: whether the team had built a dashboard to measure progress towards the key result1.
This week, we’re going to build a climate dashboard together.
We’ll focus on the Speed & Scale’s Objective #6: Remove Carbon: Remove 10 gigatons of carbon dioxide per year. This is based on a 2017 UNEP report that estimated we’ll need annual CDR of 10Gt will help achieve a 2°C scenario.
If you are unfamiliar with CDR, I’d recommend checking out CDR Primer to learn more.
“D” Stands for Data
Sooooo where’s the data? Good question, as climate datasets tend to be fragmented, unstructured & stale.
CDR today is largely purchased by private companies (“Buyers”) and removed/stored by private companies (“Sellers”). This is essentially a marketplace, where you have corporations on the buy-side looking to offset their emissions, and CDR Sellers on the sell-side removing CO2 from the atmosphere and finding ways to permanently store it (in soil, rock, water, cement, or injecting it underground).
Luckily for us, Robert Höglund at Marginal Carbon has done much of the heavy lifting to assemble a dataset of publicly announced purchases of durable (100+ years2) carbon removal with storage3. This includes seller, buyer, method, how much was purchased, and even how much the buyer paid in some cases.
There are definitely some limitations to the data, but it’s a great place to start to understand the state of the CDR market and measure our progress toward our 10Gt / yr goal by 20504.
Building our dashboard 📈
Let’s take a look at what we were able to build 😍
Headlines
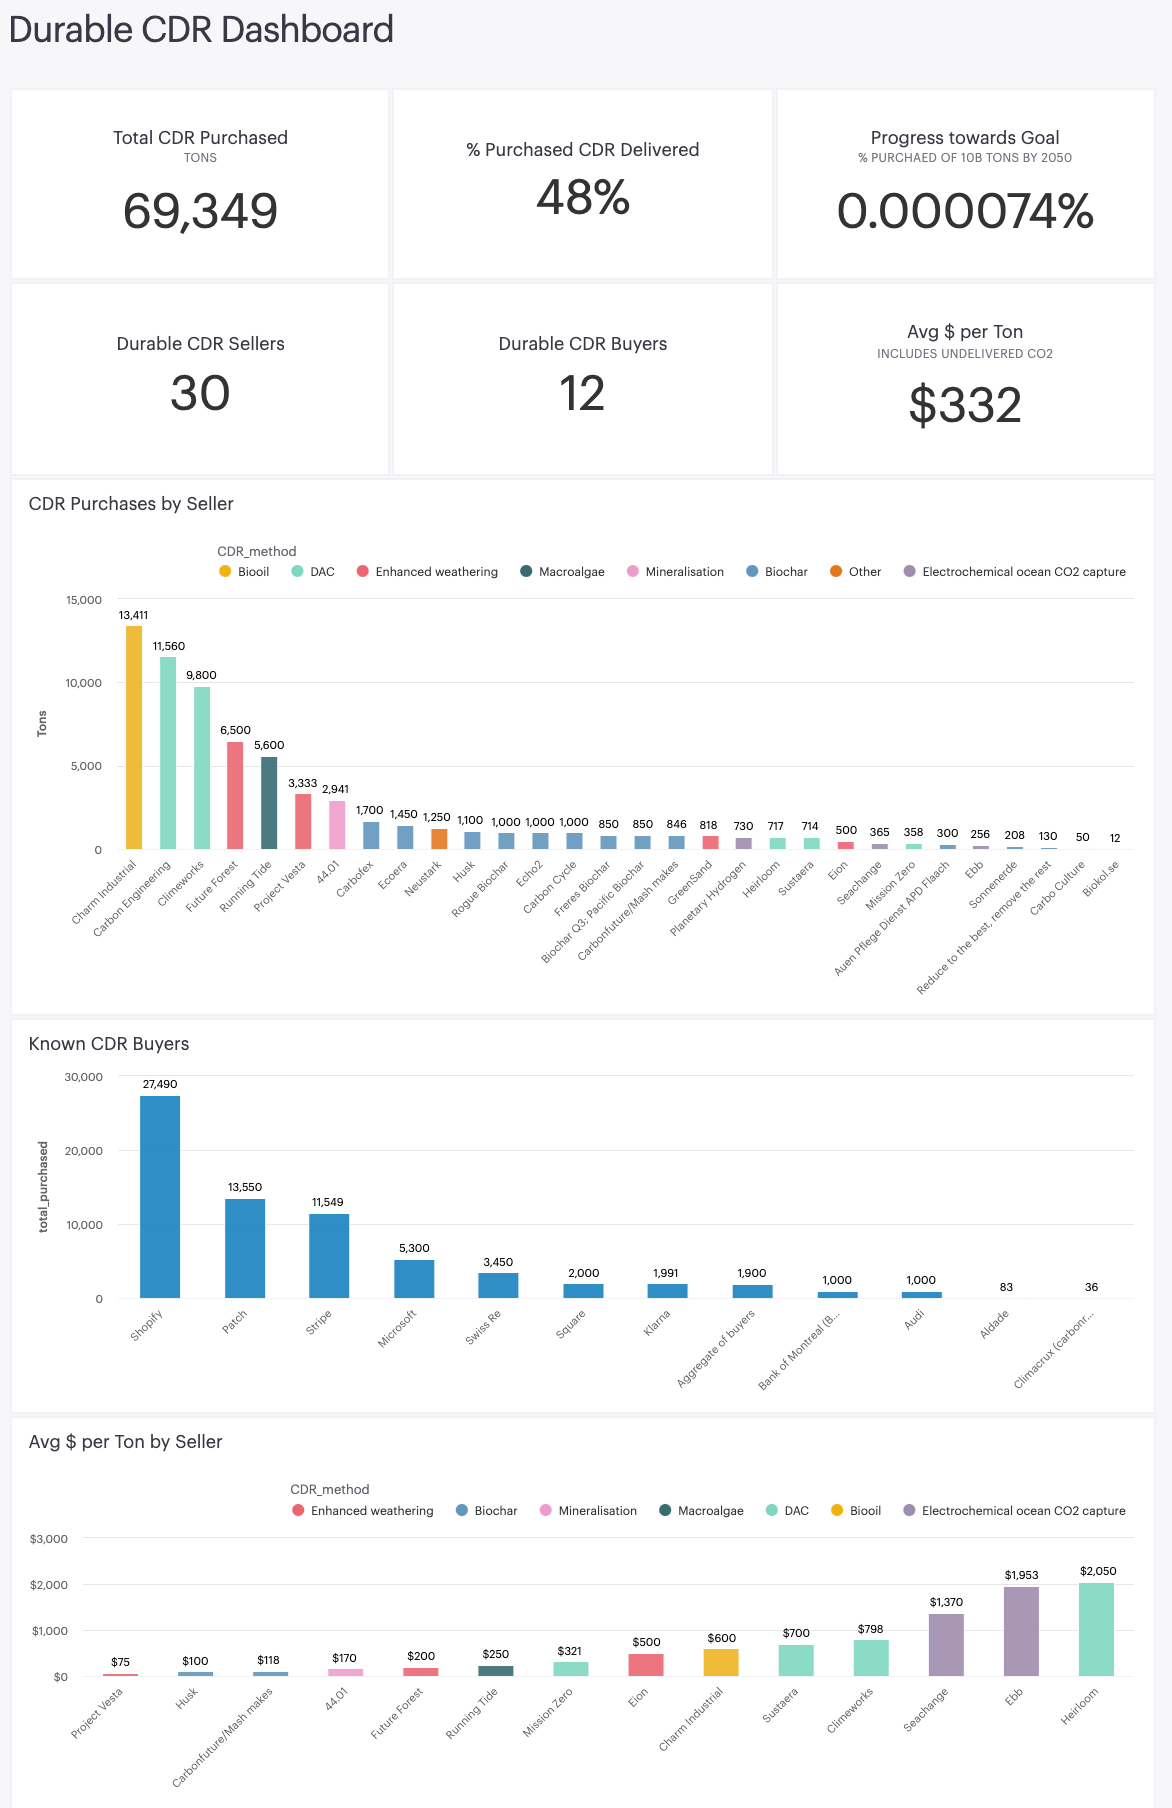
In total, there have been 69,349 tons of durable CDR purchased. 48% of that 69k has been delivered, the other 52% are purchases for future delivery. And as a percentage of that 10Gt / yr by 2050, we are only 0.0000074% towards our goal.
But we need to start somewhere!
Who’s Buying & Who’s Selling?
On the supply-side, there are 30 sellers. Charm Industrial had sold the most tons (~13k) followed by Direct Air Capture companies Carbon Engineering (~11k) & Climeworks (~10k). The top 7 Sellers account for 80% of all CDR sold, so supply is heavily concentrated in just a few companies.
On the demand-side, there were only 12 Buyers, most of which are corporations. Shopify, Patch5, Stripe, and Microsoft are the biggest buyers.
How much does a ton of CO2 cost?
With the cost data, we can derive how much a ton costs from different Sellers. The average cost is $332 per ton, but there are a few reasons we should be skeptical of this number. The first is that many of these agreements are proofs-of-concept, so this doesn’t represent the true cost of a scaled solution.
Using this average cost for a ton of CO2 ($331) x tons purchased (69k), this puts the total CDR Gross Merchandise Value (GMV) ~$20-30M.
The range of $ / ton is wide. At the lower end, Project Vesta is $75 / ton with to $2k / ton with Ebb and Heirloom.
We’ve launched a live version of the dashboard! You can find it at cdr.fyi
Takeaways
For us to achieve our climate goals, we need to set clear and measurable goals. We also need to share the data & report on progress.
CDR data today is largely self-reported and unstructured, which limits our visibility into progress. There’s an opportunity to create data & reporting standards that can provide us
The CDR market is still very early! 30 Sellers, 12 Buyers, $20M transaction volume, 69k tons, .000074% where we need to be. Exciting progress and healthy competition among Buyers & Sellers is going to help lead to a cooler climate.
Another one to call out is having a clear owner for the goal. This is a tough challenge as climate inaction is a tragedy of the commons. No one “owns” soil health. There’s nobody responsible for bringing battery tech down the cost curve.
The dataset includes biochar, which degrades at an estimated rate of 0.3% per year. A more advanced model might discount the delivered carbon based on a degradation rate based on the CDR method.
Stripe has also open sourced their purchasing process and proposals are available via CarbonPlan.
There are a few limitations to call out about this dataset. The first is that this dataset is almost certainly incomplete, in that not all negative emission purchases are publicly announced. This means our dashboard is likely to understate the current state of the CDR market. Given that the market is early and unproven, both buyers and sellers have incentives to share their investments here, but there is no requirement that these purchases are made public. The second limitation is that much of the data are missing specific delivery milestones. For example, many of the purchases include a time range for delivery (“e.g. 10 tons were purchased and will be delivered 2021-2022”). Finally, where there are targets, it’s unclear whether they have been met. For this dashboard, we assume that they are being met but include more in the discussion sections. The other limitation to the dataset is that it’s focused on durable negative emissions v. all carbon sinks (e.g. planting trees that are at risk of burning down).
Note that the Patch data is based off what is listed on the Persefoni marketplace. These tons may be available but may or may not be purchased.


