ClimateDB
How can climate data save the planet
Note: We’re working on a project to make climate data more accessible. If you’re a climate data junky, check out climatedb.io
Climate & citizen researchers should be able to easily access trusted, comprehensive climate datasets to understand how the climate crisis is unfolding and what can be done to stop it. Unfortunately, the state of climate data is highly-fragmented, ungoverned, and unmanaged.
Problem
The climate crisis is evolving rapidly. Since you started reading this memo, roughly 10,000 tons of CO2 were released into the atmosphere from fossil fuels.
Our efforts around the climate crisis is also changing rapidly. In 2021, climate tech companies raised over $30B. The academic community has published ~4,000 papers per year on the climate change since 2000 (many containing important datasets!). From EVs to kelp farming to satellite methane mapping...climate research, climate business models, and climate data is exploding.
Unfortunately, the climate data we need to measure our climate progress is...
fragmented: Climate data often lives squirreled away in a PDF on a research labs website. It is unstructured. It takes time to find if the dataset exists, what format it’s in, and what licenses data has been released under. For example, CAISO provides hour-by-hour fuel mix in .csv format...but the files are partitioned by day. Answering questions like “what was the mix for October
unstructured: Climate data is frequently unstructured and ungoverned. Because there is no central standards for publishing climate data, timeseries data dates will be formatted however the publisher wishes. Same with geographic regions. This lack of standardization makes combining datasets tedious to impossible.
stale: Climate data is frequently outdated. Determining what the carbon emissions today is impossible. And for data that is published in near realtime, you frequently have to query and munge the data manually, introducing delays into your reporting / models.
At Segment, we had a rule that any data we wanted analyzed needed to be in a data warehouse. Sure, our analytics team could export data from various internal data stores or hit an internal API for data. But often the difficulty of accessing that data was enough of impediment to deter even the bravest analysts. The available data gets analyzed; inaccessible data gets stale.
We need a climate data platform (CDP!) that can...
ingest public climate data (keeping it up to date as new data is published)
structure, standardize and index the dataset
allow researchers to query and combine that data to answer questions, monitor progress, and build on each other’s work
Demo
For this demo, I manually loaded some interesting datasets into BigQuery and used Mode to query/visualize.
Let’s take a look at the biggest emitters of emissions by sector in the US. CarbonMonitor provides an open-source data set and they have a cool dashboard feature on their website, but it’s limited to the pre-populated charts.
US Emissions by Sector
So let’s use Climate Analytics and write some SQL:
Boom! Looking at data since January 2019:
Now let’s visualize it...
Woah!
Note the winter seasonal spikes in Residential (dark blue)
Interesting the Power Sector tends to spike during the summer (red)
Check out the covid-19 dip in April 2020
And if we look at this on a % basis, Power + Ground Transportation account for 64% of total US emissions
I would looooove to join in weather data here to see how correlated emissions spikes are with heat waves / cold snaps
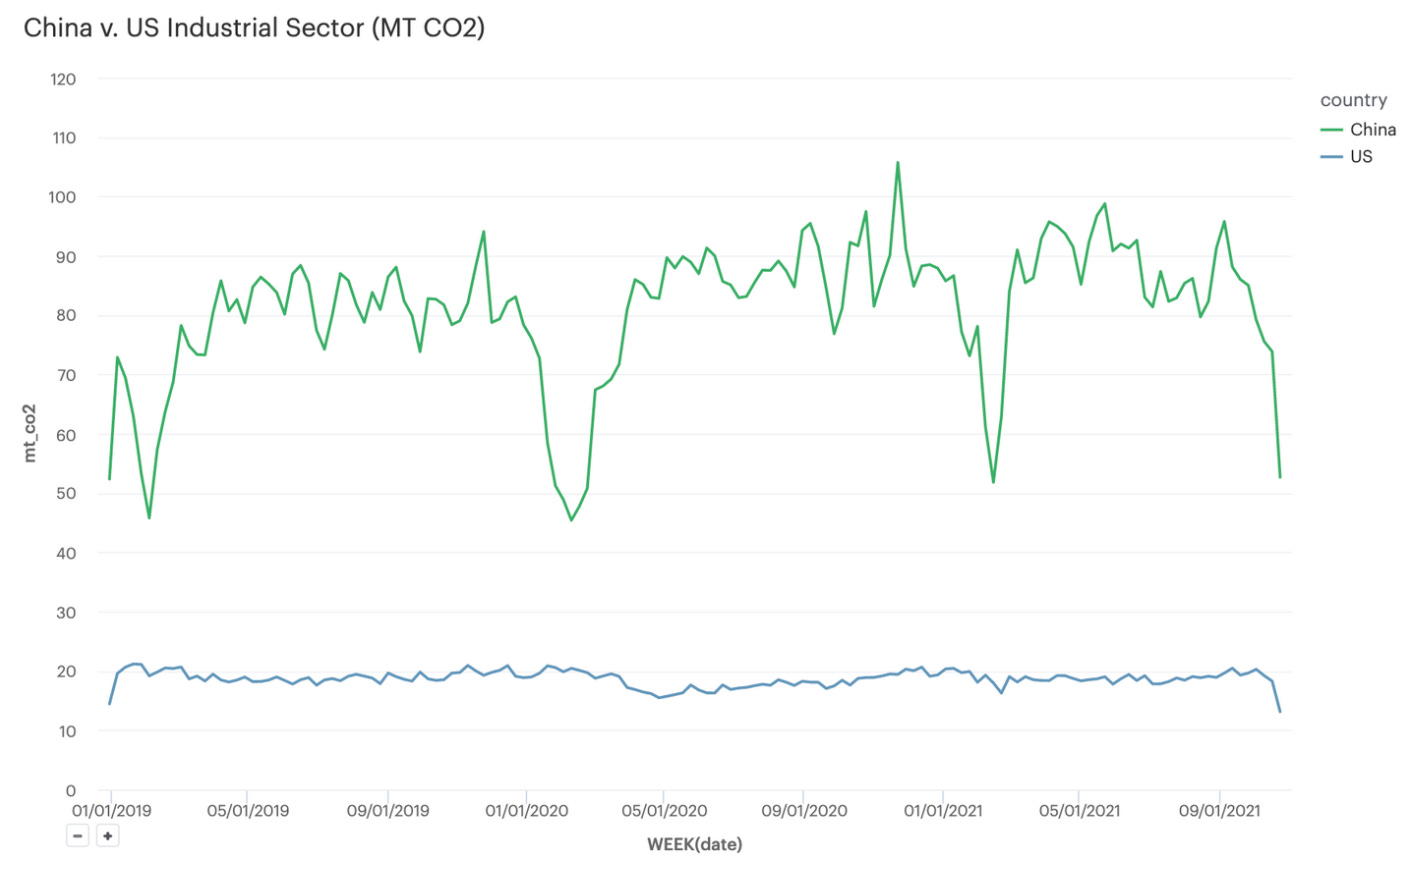
US v. China Industrial Emissions
Alright, second question. Let’s go global and compare US v. China industrial emissions...
Anddddd chart it...
Chinese Industrial sector 3-4x emissions of US industry
Note the troughs every year in early Feb around Chinese New Year
Also check out the “COVID offset” as China shut down in 2/2020 and US shut down in 4/2020
All this goodness off just one dataset!
Let’s add in some CAISO Data
CAISO provides csv extracts of daily fuel mixes (note: the CSV dates aren’t formatted properly so had to do some cleanup!)
Alright, now let’s look at total US emissions from the power sector (from carbonmonitor )x biogas fuel mix from CAISO. With a simple join...
These two datasets have never been viewed before! (that I know of 🙂)
What’s the dream state?
Realtime data feeds of every emission + sink + global climate accounting dashboard
Data scientists + analysts are able to access data to build/share models + dashboards


